My role
I run the Academy’s front end, and I edited and published every course released in 2026, including those drafted by our broader team. I was involved in scripting, filming, and editing every product video except for our live trainings.
The problem
The Academy was organized by internal product area, so nonprofits had to know which product to look under before they could find help. Courses sometimes ran long, and success was measured by enrollments and completion rather than product success.
What I did
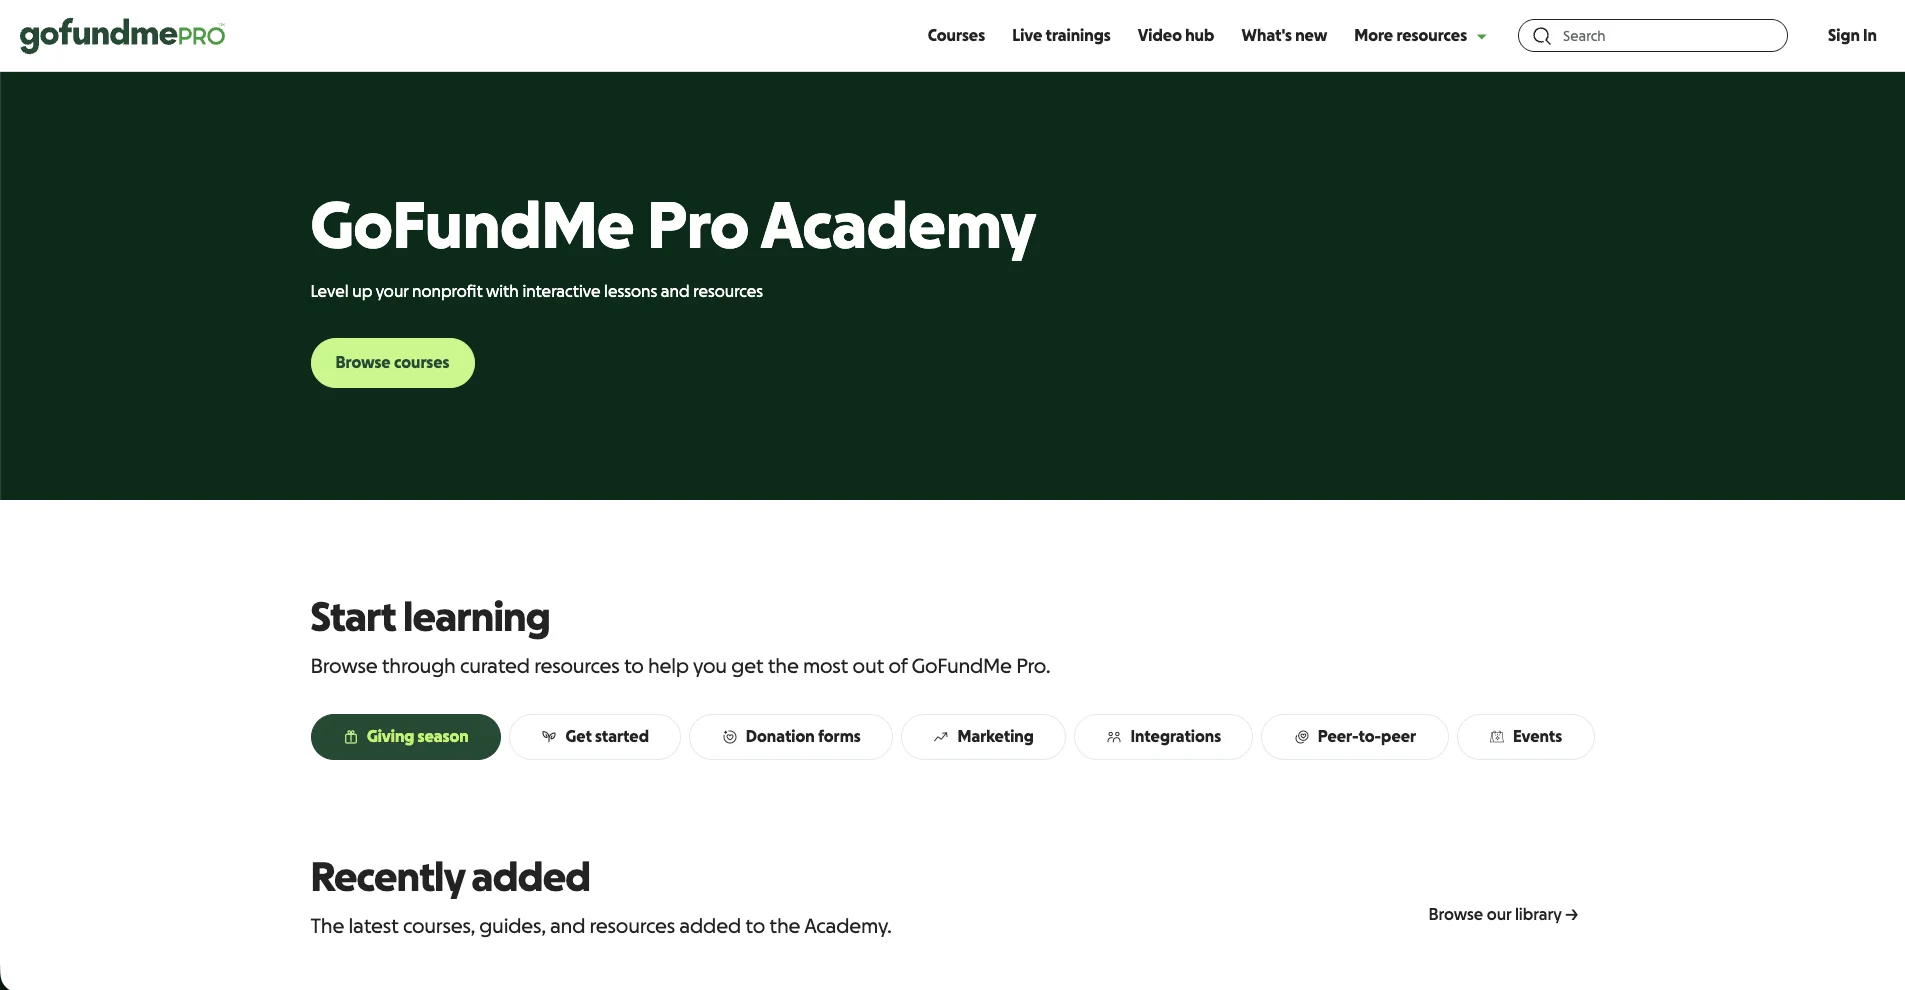
- Reorganized the Academy around customer tasks: a use-case-first home page, a filterable library, and reusable components I built myself.
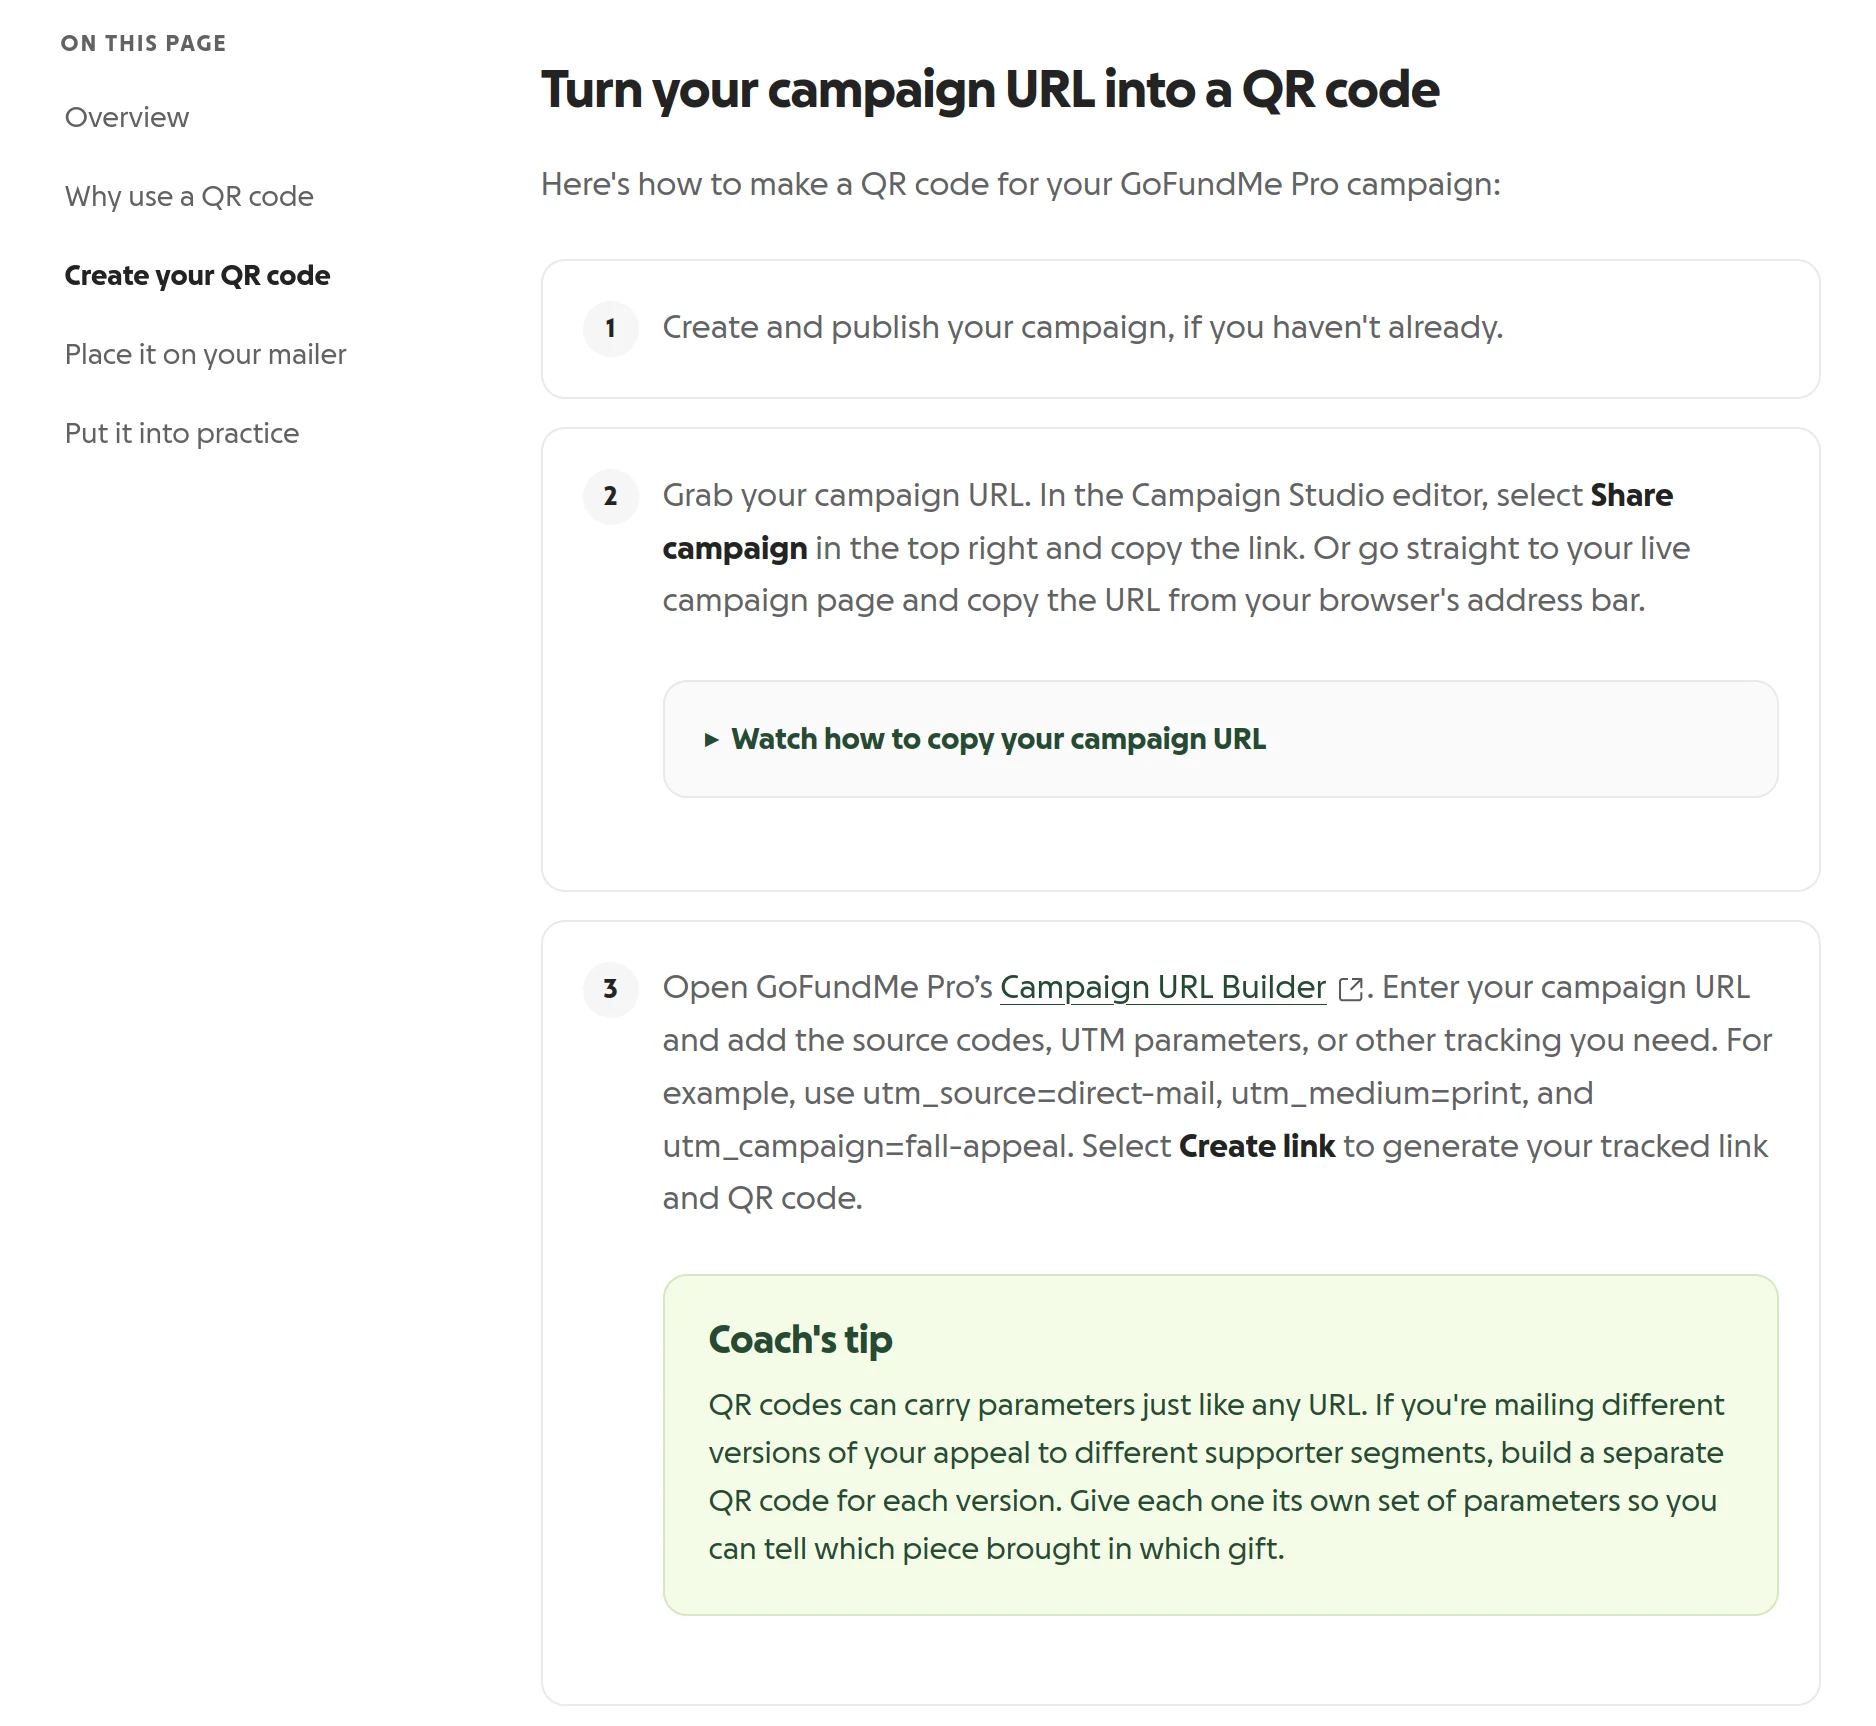
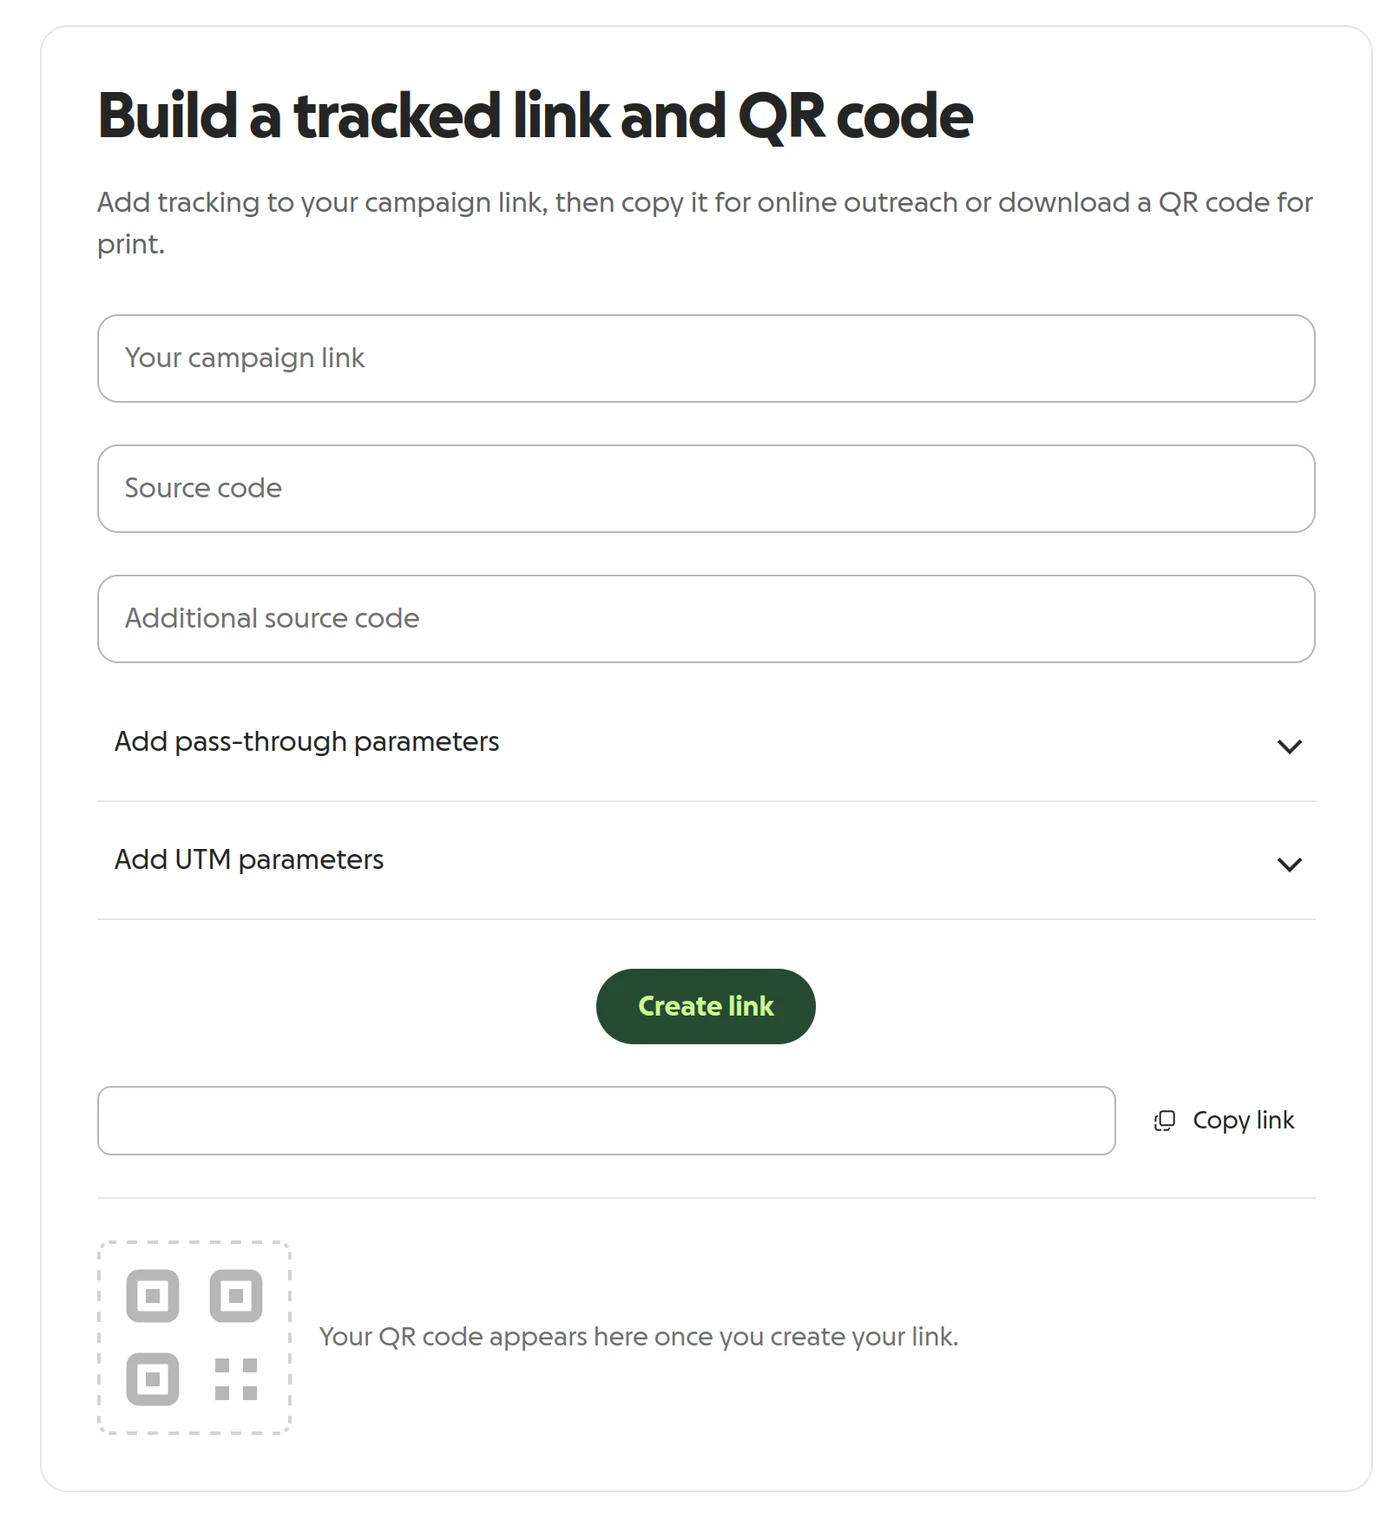
- Kept learning short and task-sized. In the first half of 2026, we shipped 25 self-paced courses, plus a campaign URL builder with print-ready QR codes that became the Academy’s third most-visited page in 2026.
- Made video a system, not a solo act: short how-tos, recording guidelines so the Care team can contribute footage, and the library mapped to the SEO team’s target keywords for a YouTube launch.
- Audited the data and changed how we read it. Open-access courses don’t create enrollments, so I combined LMS data with page views to see real use and compared these metrics to available product data.
Inside one course
Track where your donations come from teaches admins to tag campaign links with UTM parameters and trace each donation back to where it came from. It was written for the feature’s August 2026 release, and I oversaw it from intake through review.
Start from what learners will do. The outline set four measurable outcomes before any drafting. Learners will be able to:
- Match each UTM parameter to the question it answers, and name the three to start with.
- Build a tagged link with the URL builder, following naming rules they can reuse.
- Add the UTM columns to their Transaction History report and trace a donation to its source.
- Name the two reasons a UTM column can be blank, and what you can use instead.
Check the plan before writing it. A rigor check between outline and draft caught three problems while they were still cheap to fix:
- A product claim sourced to a marketing blog instead of the product
- Examples that used dropdown values nobody had confirmed exist
- The report’s name, written four different ways
Cut to the size of the task. The first draft had three lessons and about 3,100 words. The task itself is one sitting: expand a section, pick a source, fill in three fields, and copy the link. We cut it to a single lesson of about 1,400 words.
Decide the words before the learner meets them. “Campaign” means two things here: the fundraising page an organization builds, and the marketing effort that utm_campaign names. The lesson keeps “campaign” for the page and says “appeal” for the effort, with a callout where the two meet.
Measure in the product. Our Academy doesn’t run quizzes. We judge courses by whether admins complete the task in the product afterward, because that’s the outcome the business needs.
Since launch, we’ve seen the course and URL builder visited by ~4,000 users and have seen more than 2,000 nonprofit organizations adopt tracking parameters on their links.
Inside one video
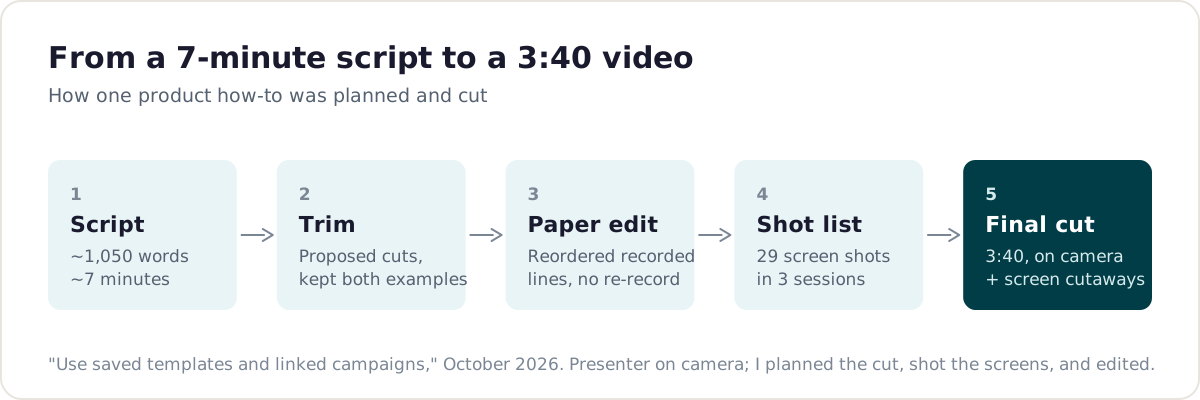
My newest how-to, on saved templates and linked campaigns, shows the process. The presenter’s script ran about seven minutes. Instead of asking her to re-record, I built a paper edit from lines she had already recorded, planned 29 screen shots across three sessions, and cut it to 3:40.
Results
| Evidence | What it shows |
|---|---|
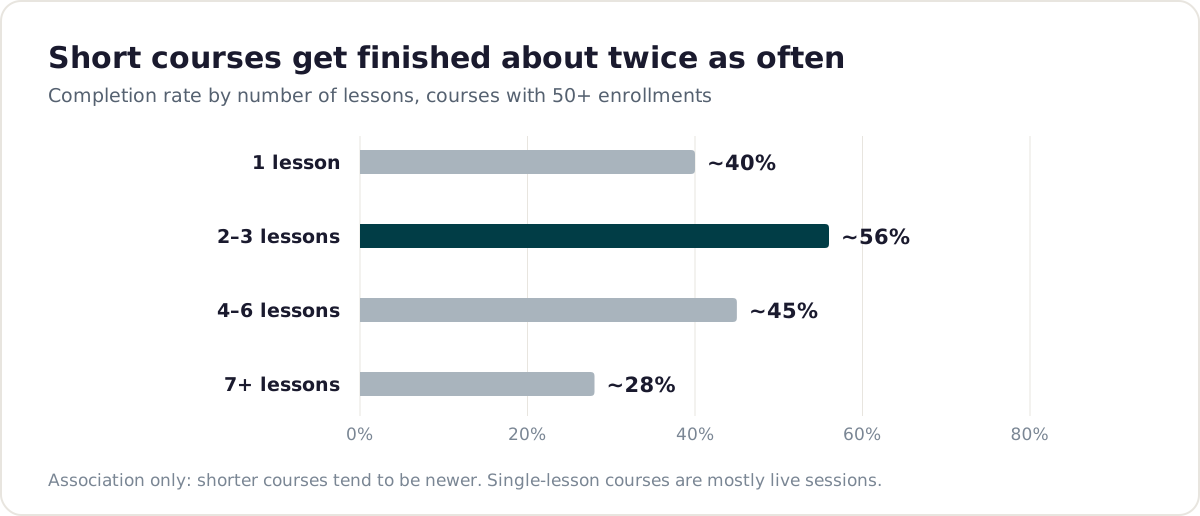
| Courses with 2–3 lessons have a completion rate above 50%; 7+ lessons, about 28% | Short courses finish about twice as often |
| A summer 2026 series of short Live Events courses has a 75% completion rate | The short format works in practice |
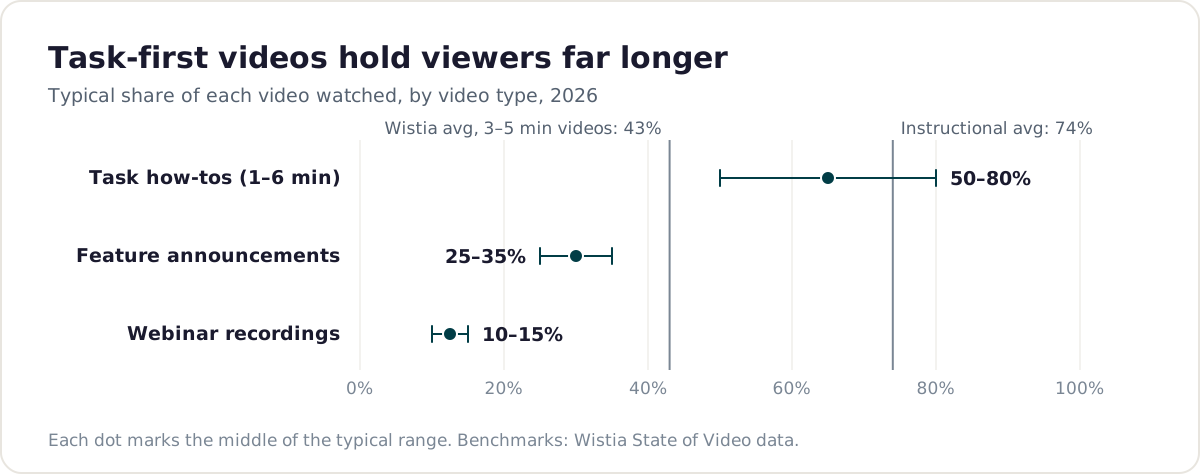
| Quick how-to videos are watched about 50–80% through on average; our newest videos match instructional-video benchmarks (about 74%) | Task-first video holds attention |
| How-tos made since spring trend higher than earlier ones | The craft improved over the year |
What I learned
The best learning experience is usually the smallest one that gets someone through their task. And the right metric likely doesn’t live in our Academy, but in the product data itself.